Dashboard
Is anything wrong. Cluster size, how many nodes are answering, and what has happened recently.
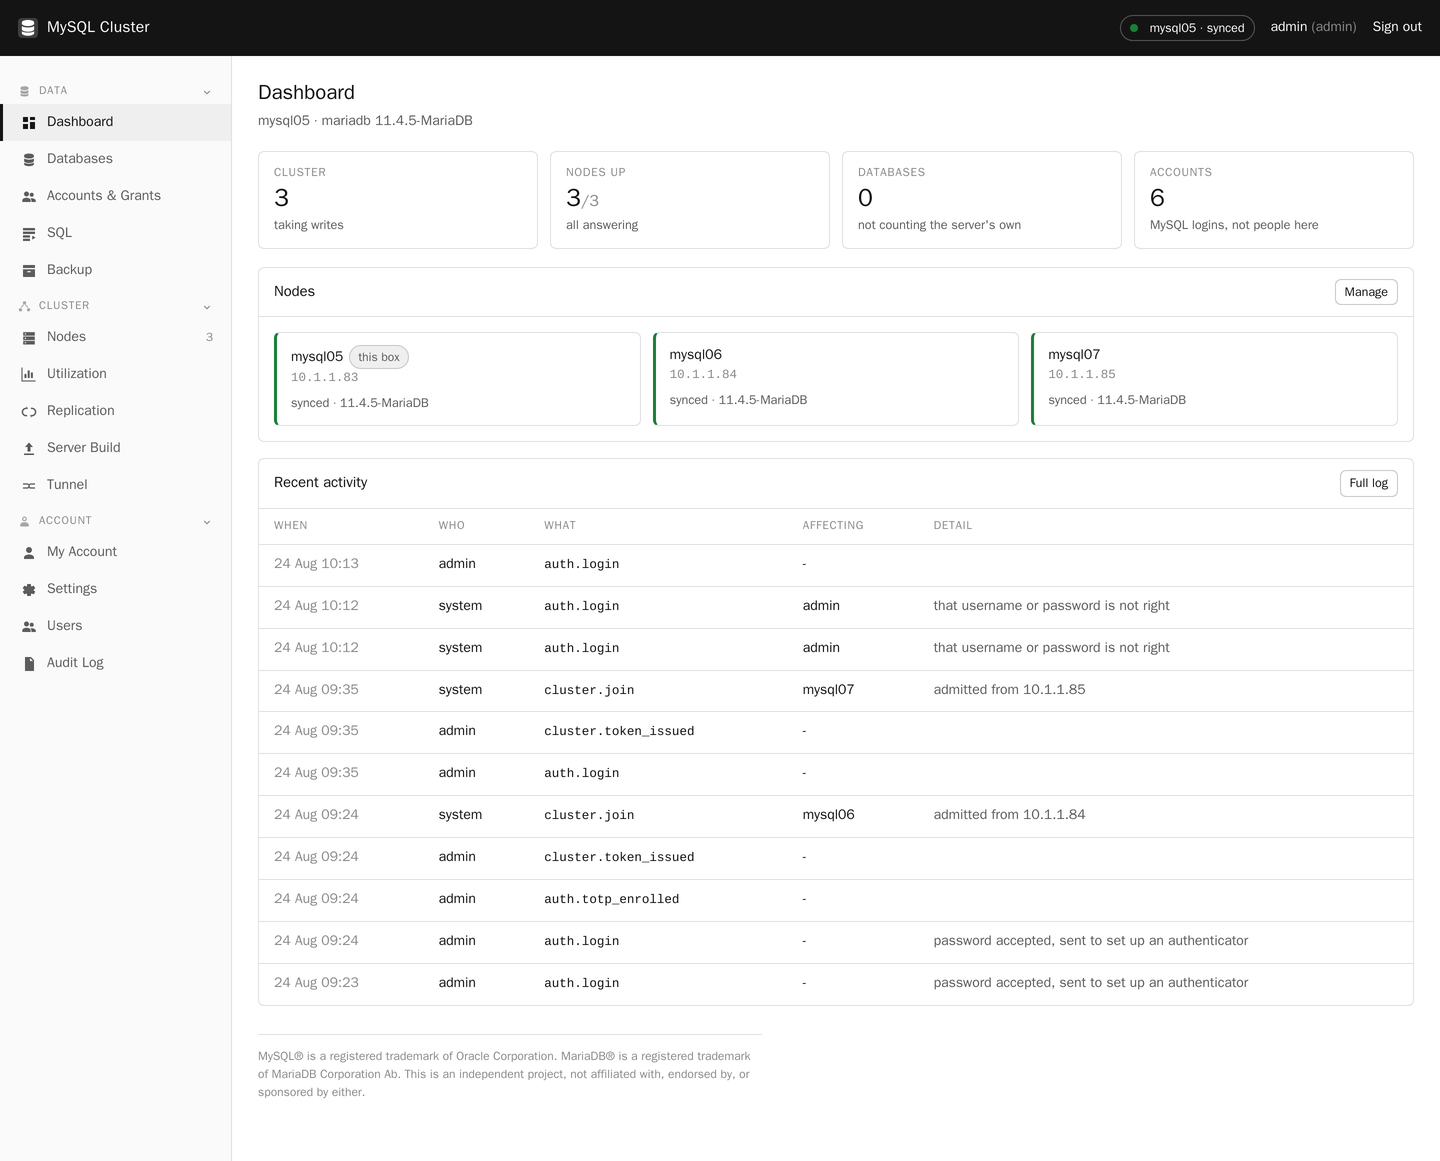
A real cluster of three machines, not a mockup. The machines are called mysql05, 06 and 07 because that is what they were called.
Is anything wrong. Cluster size, how many nodes are answering, and what has happened recently.
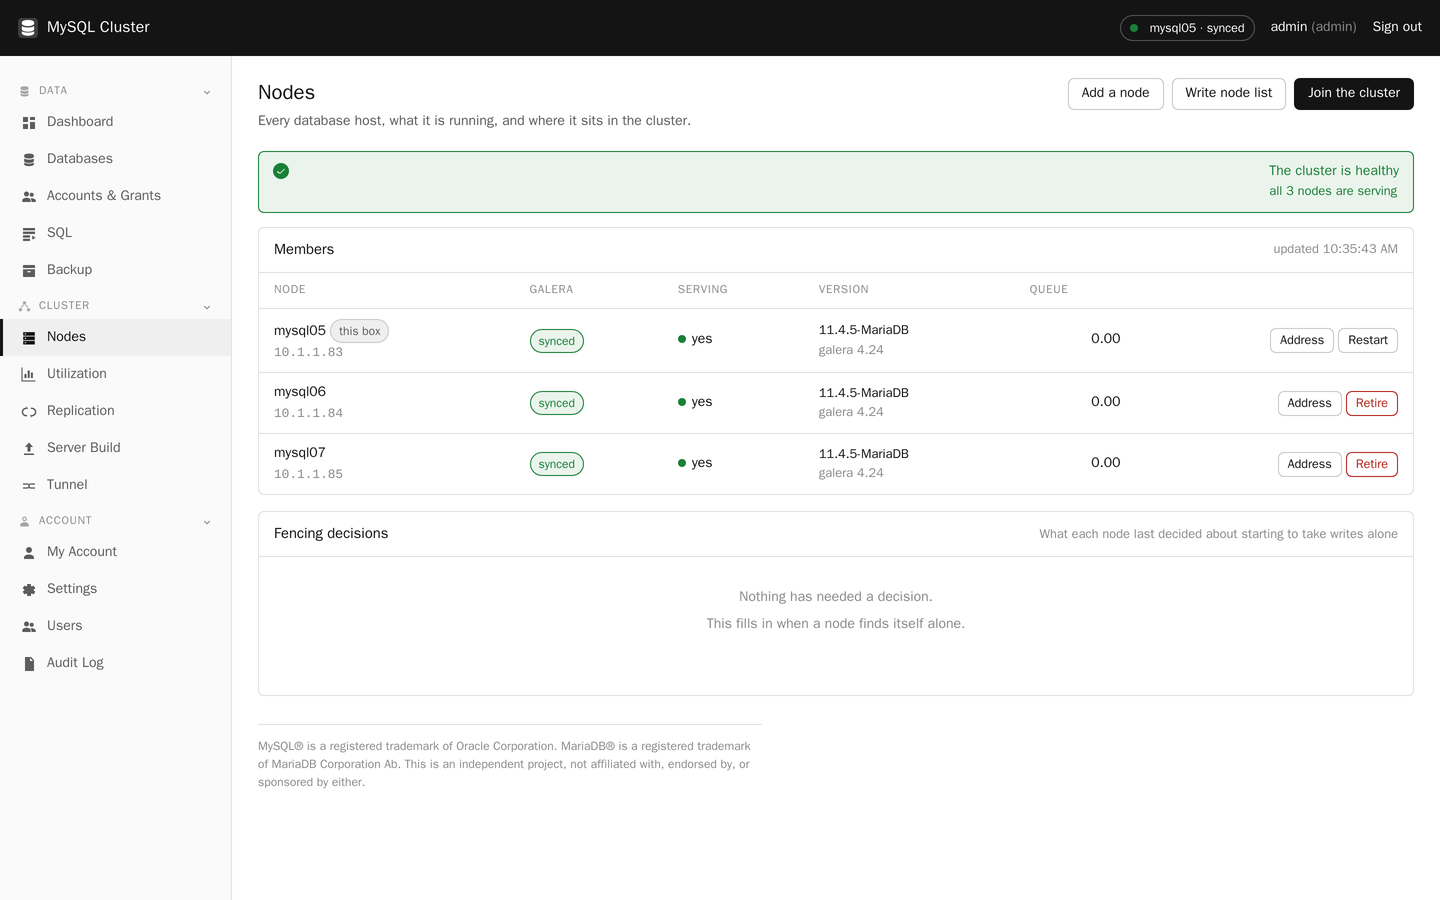
Every machine, its Galera state, its version and its apply queue. The queue is the number that moves first when a node starts struggling.
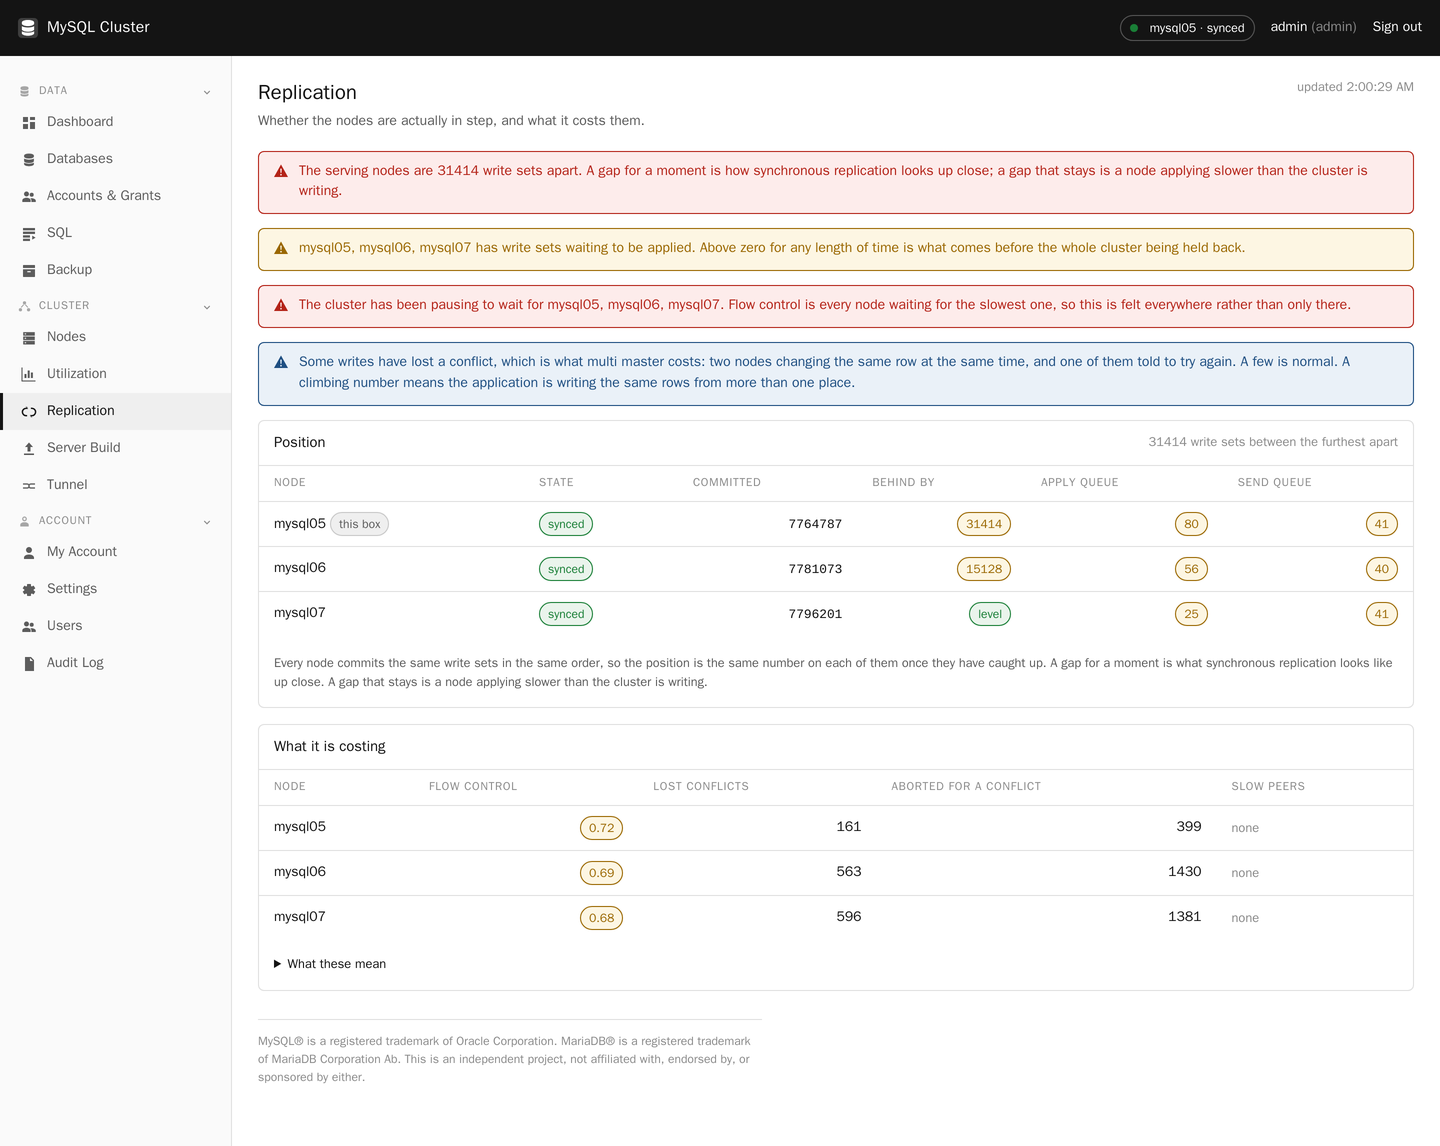
Whether the nodes are actually in step, and what it costs them: flow control and certification conflicts.
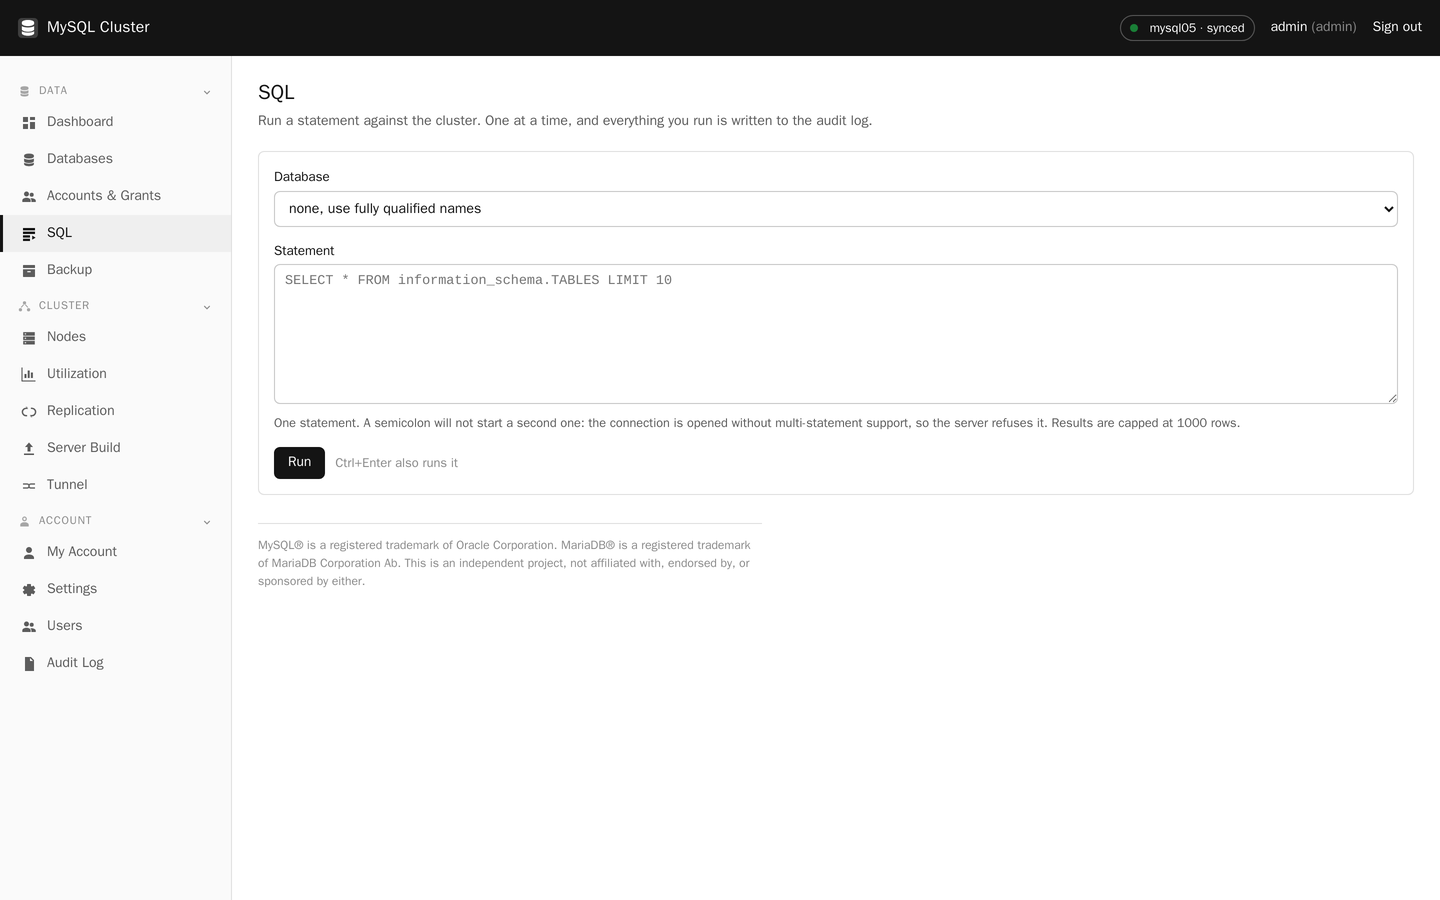
Processor, memory, disk and query rates over time, all three nodes on one chart. Drag to select a span and every chart narrows to it.
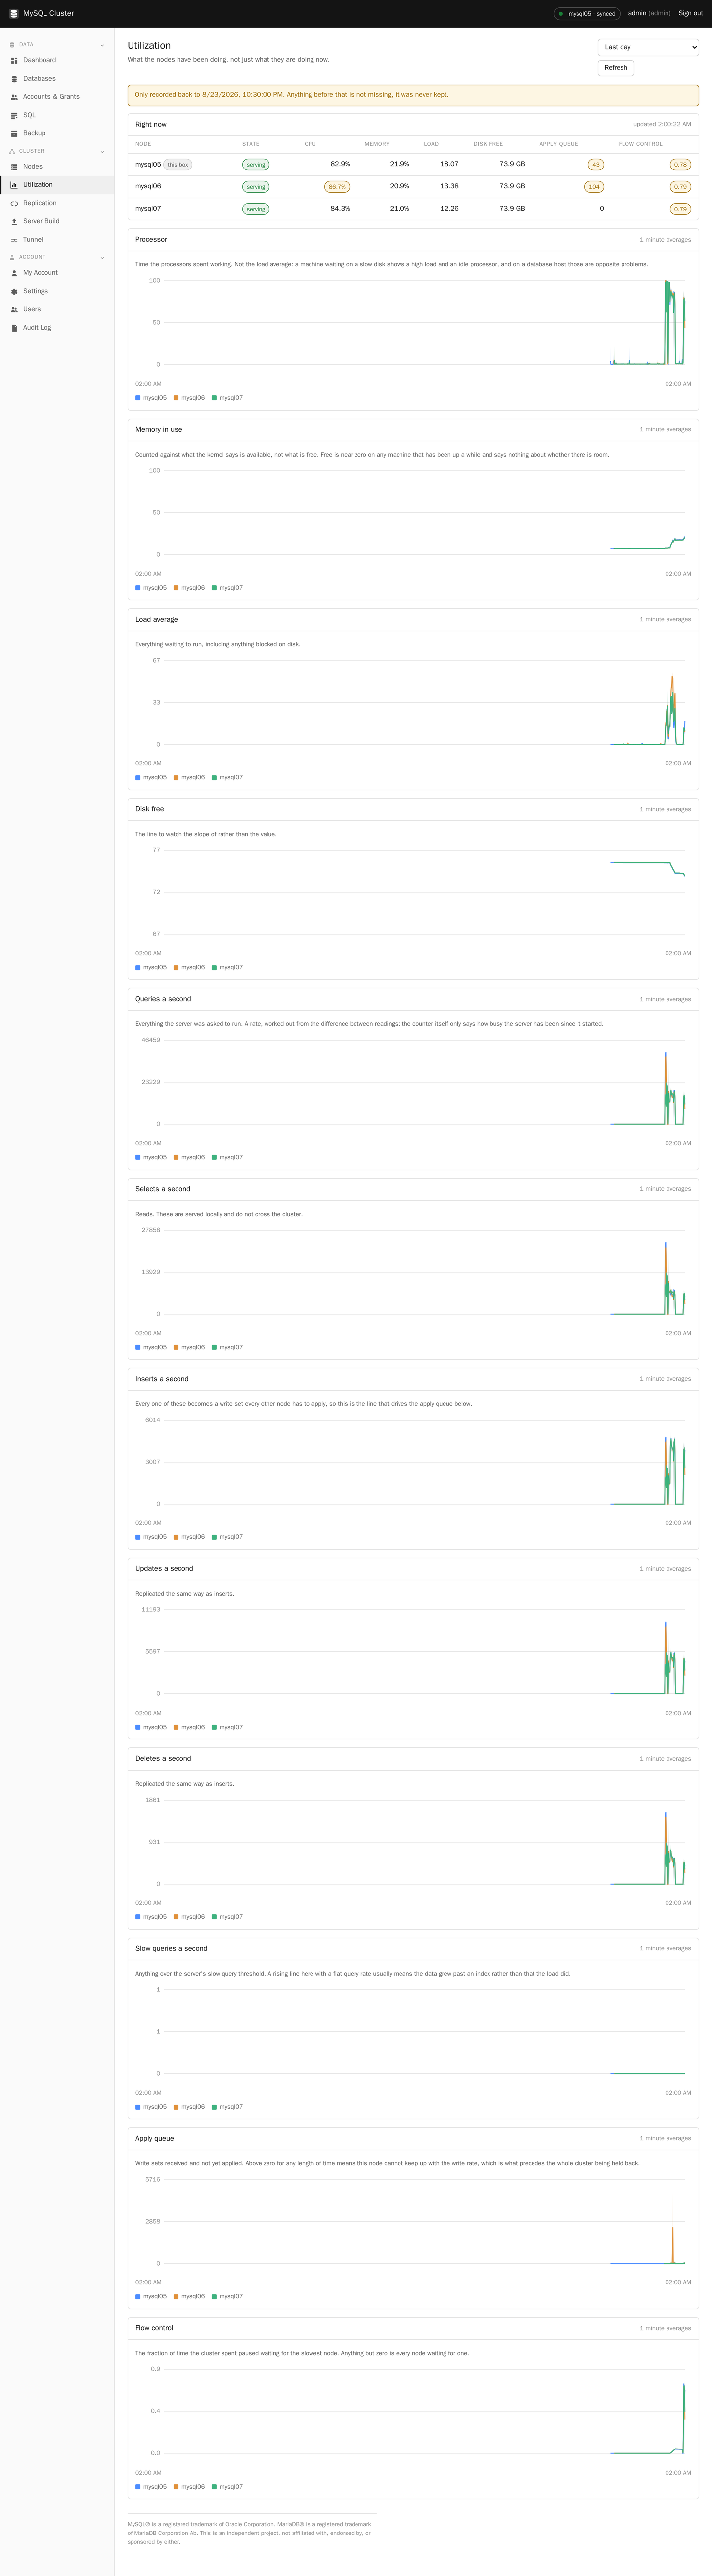
What schemas exist, how big they are on disk, and what is inside them.
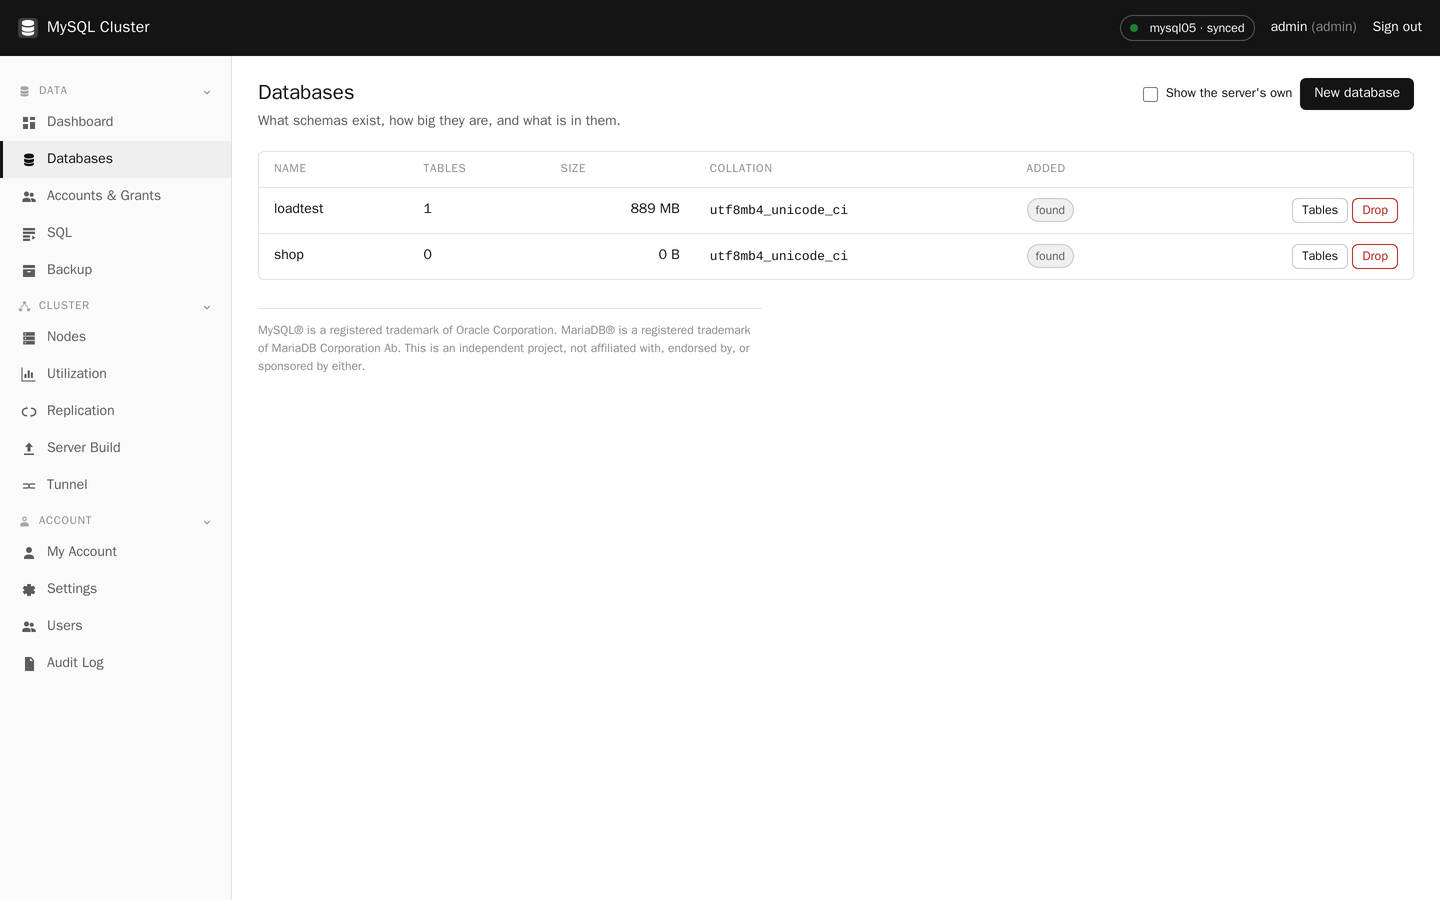
MySQL logins, with the host half always shown because that is the part that catches people out.
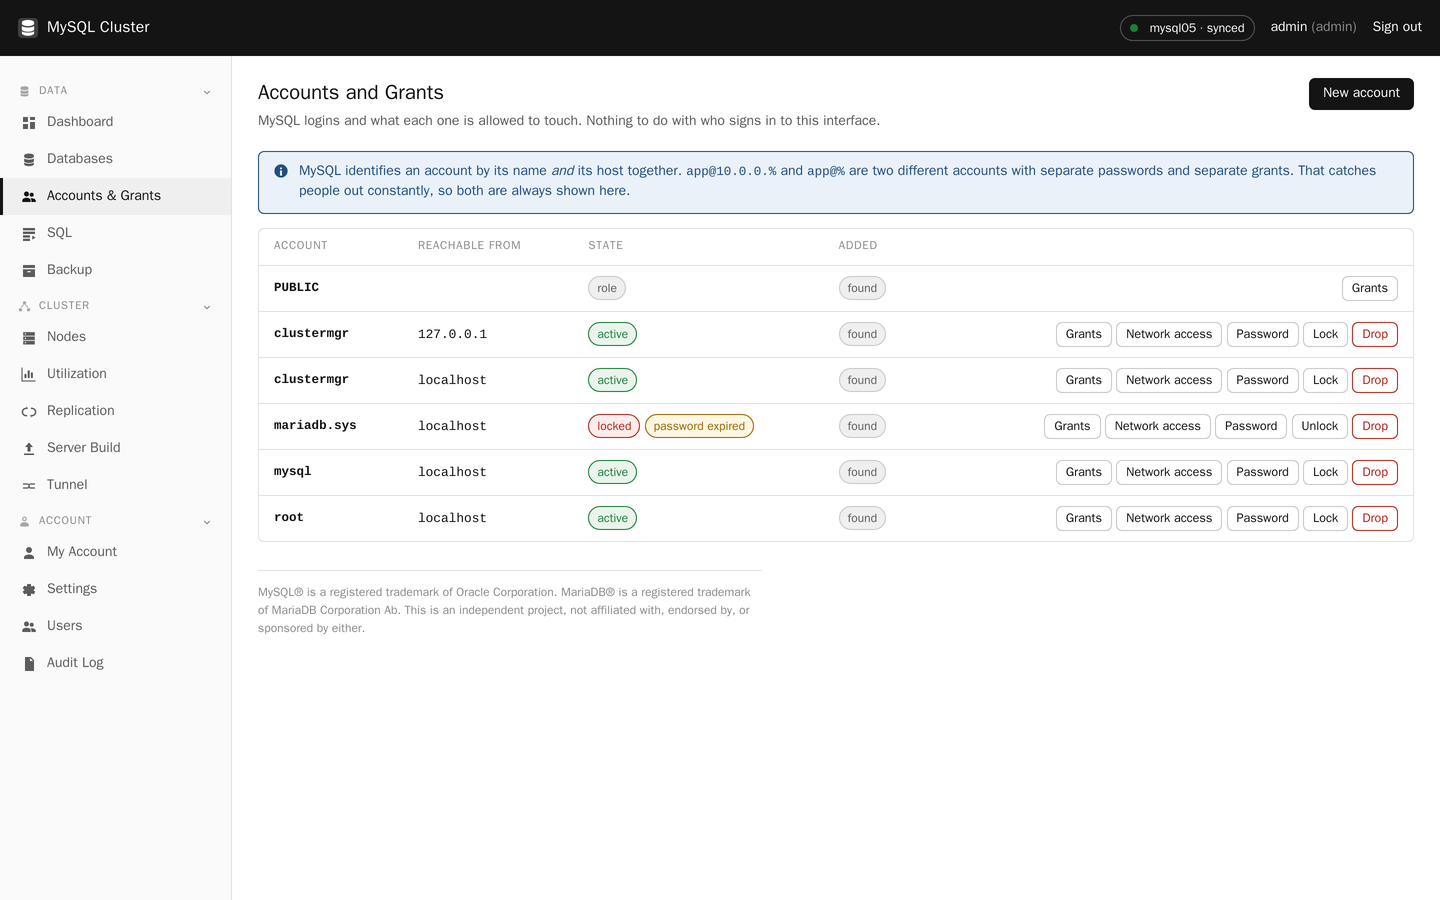
One statement at a time, split by read and write permission, and every one recorded in the audit log.
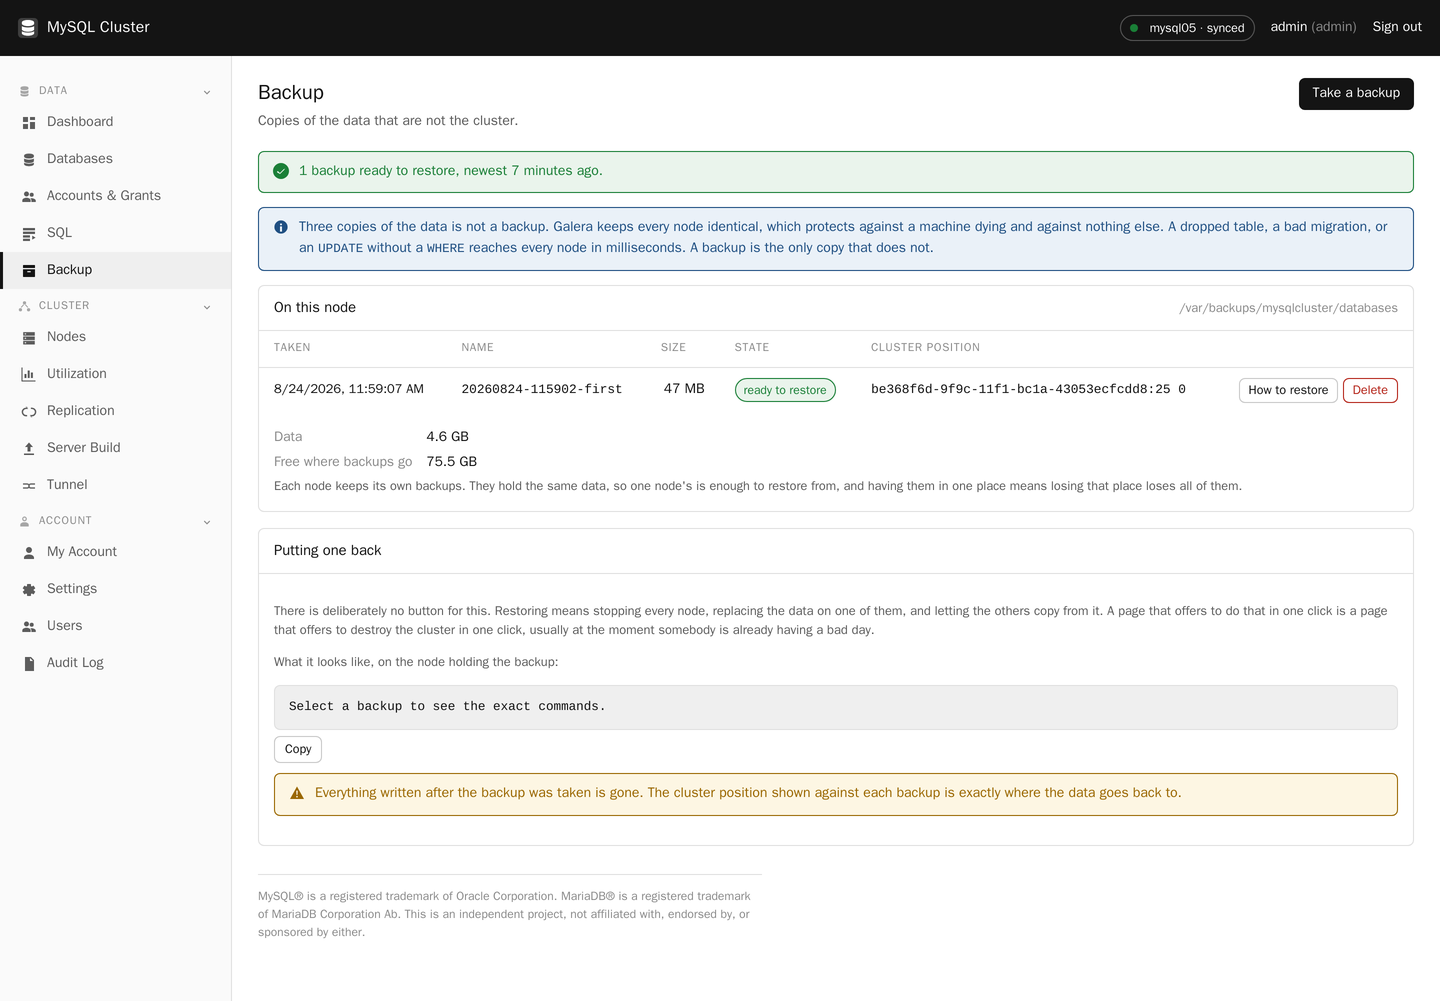
Copies that are not the cluster. There is deliberately no restore button; it gives you the exact commands instead.
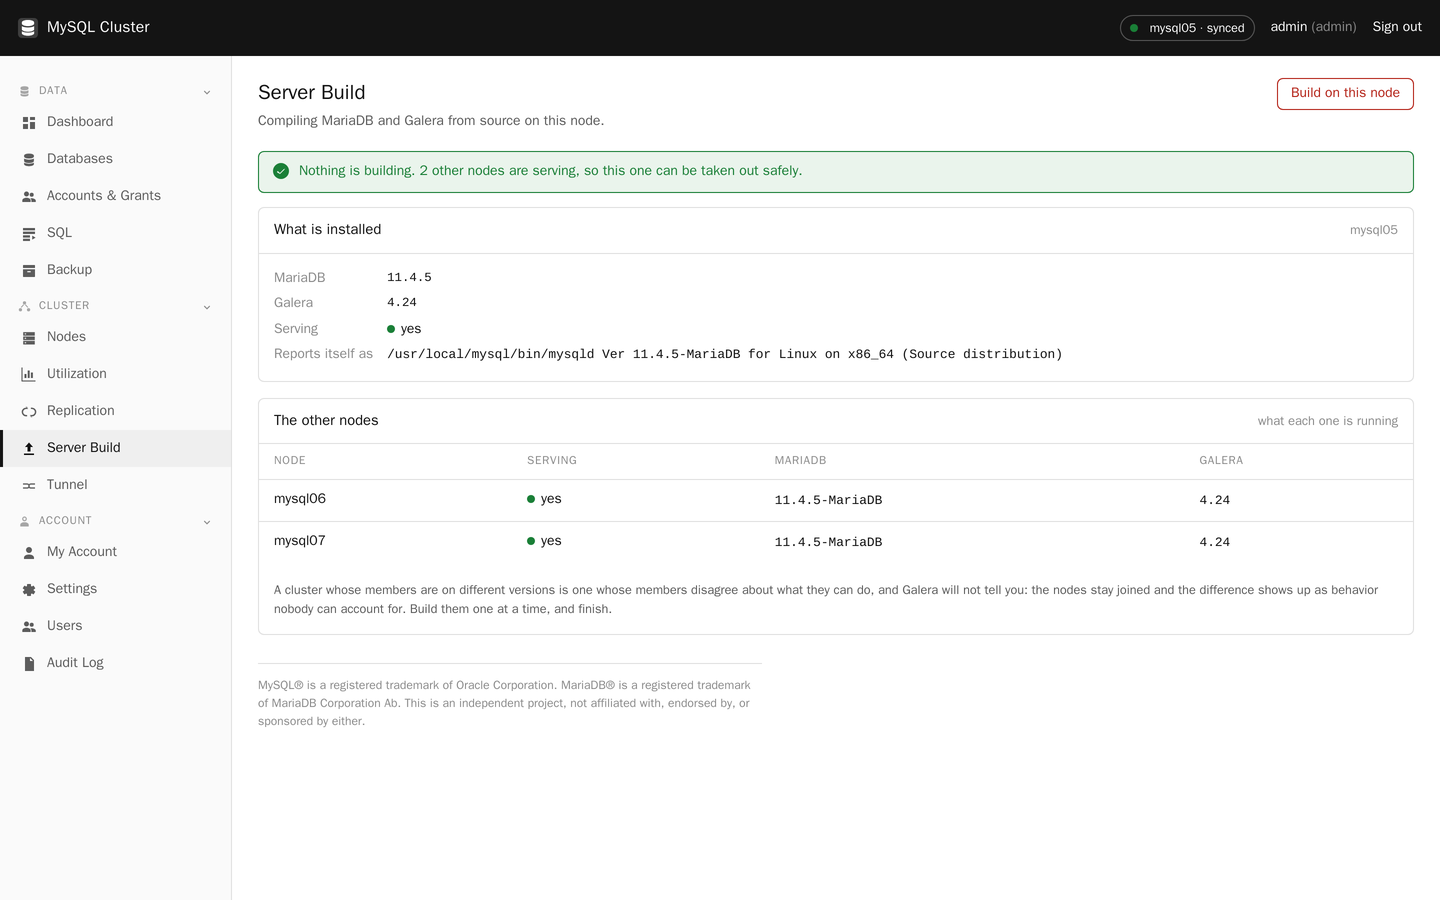
Compiling MariaDB and Galera on a node, and what every other node is running.
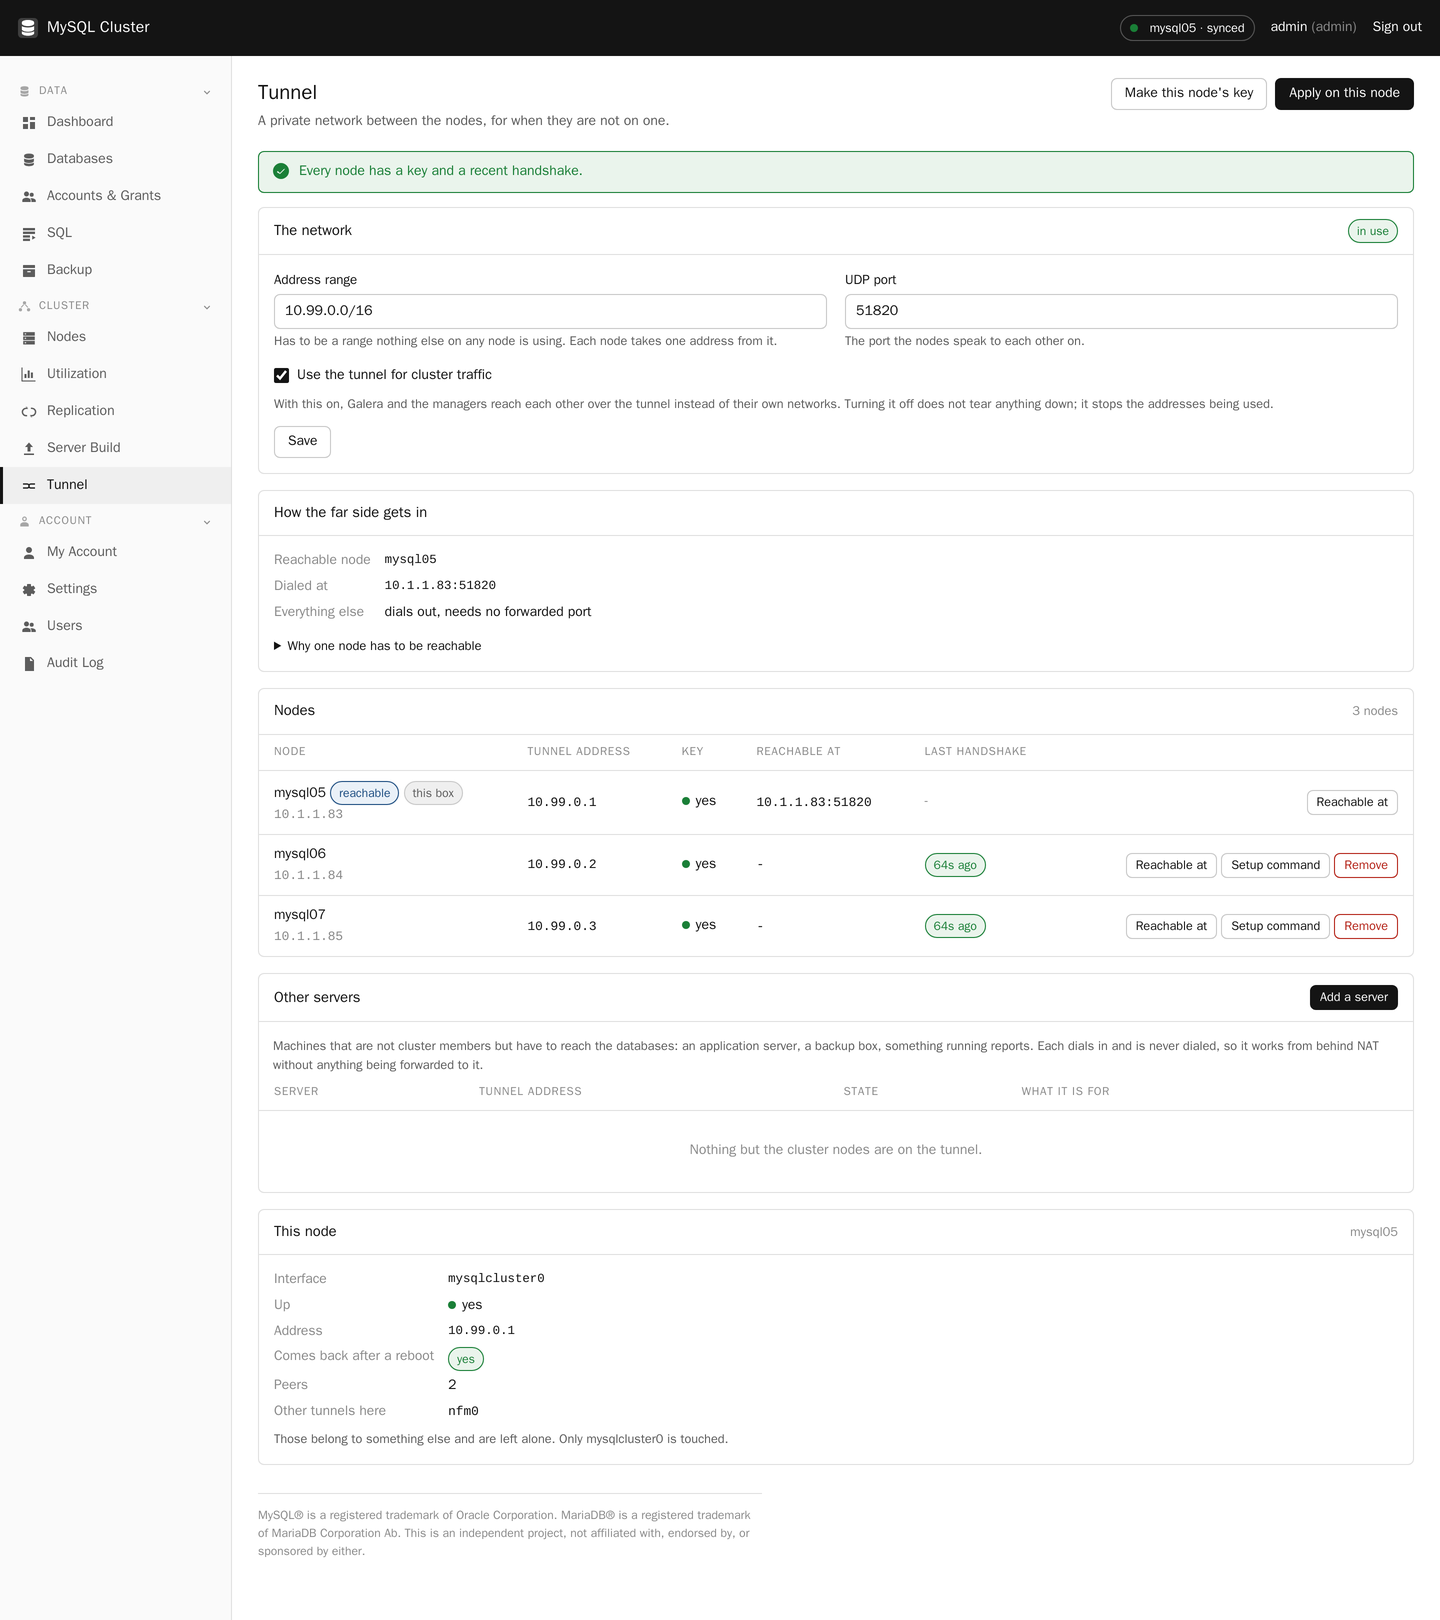
A private WireGuard network between the machines, for when they are not on one.
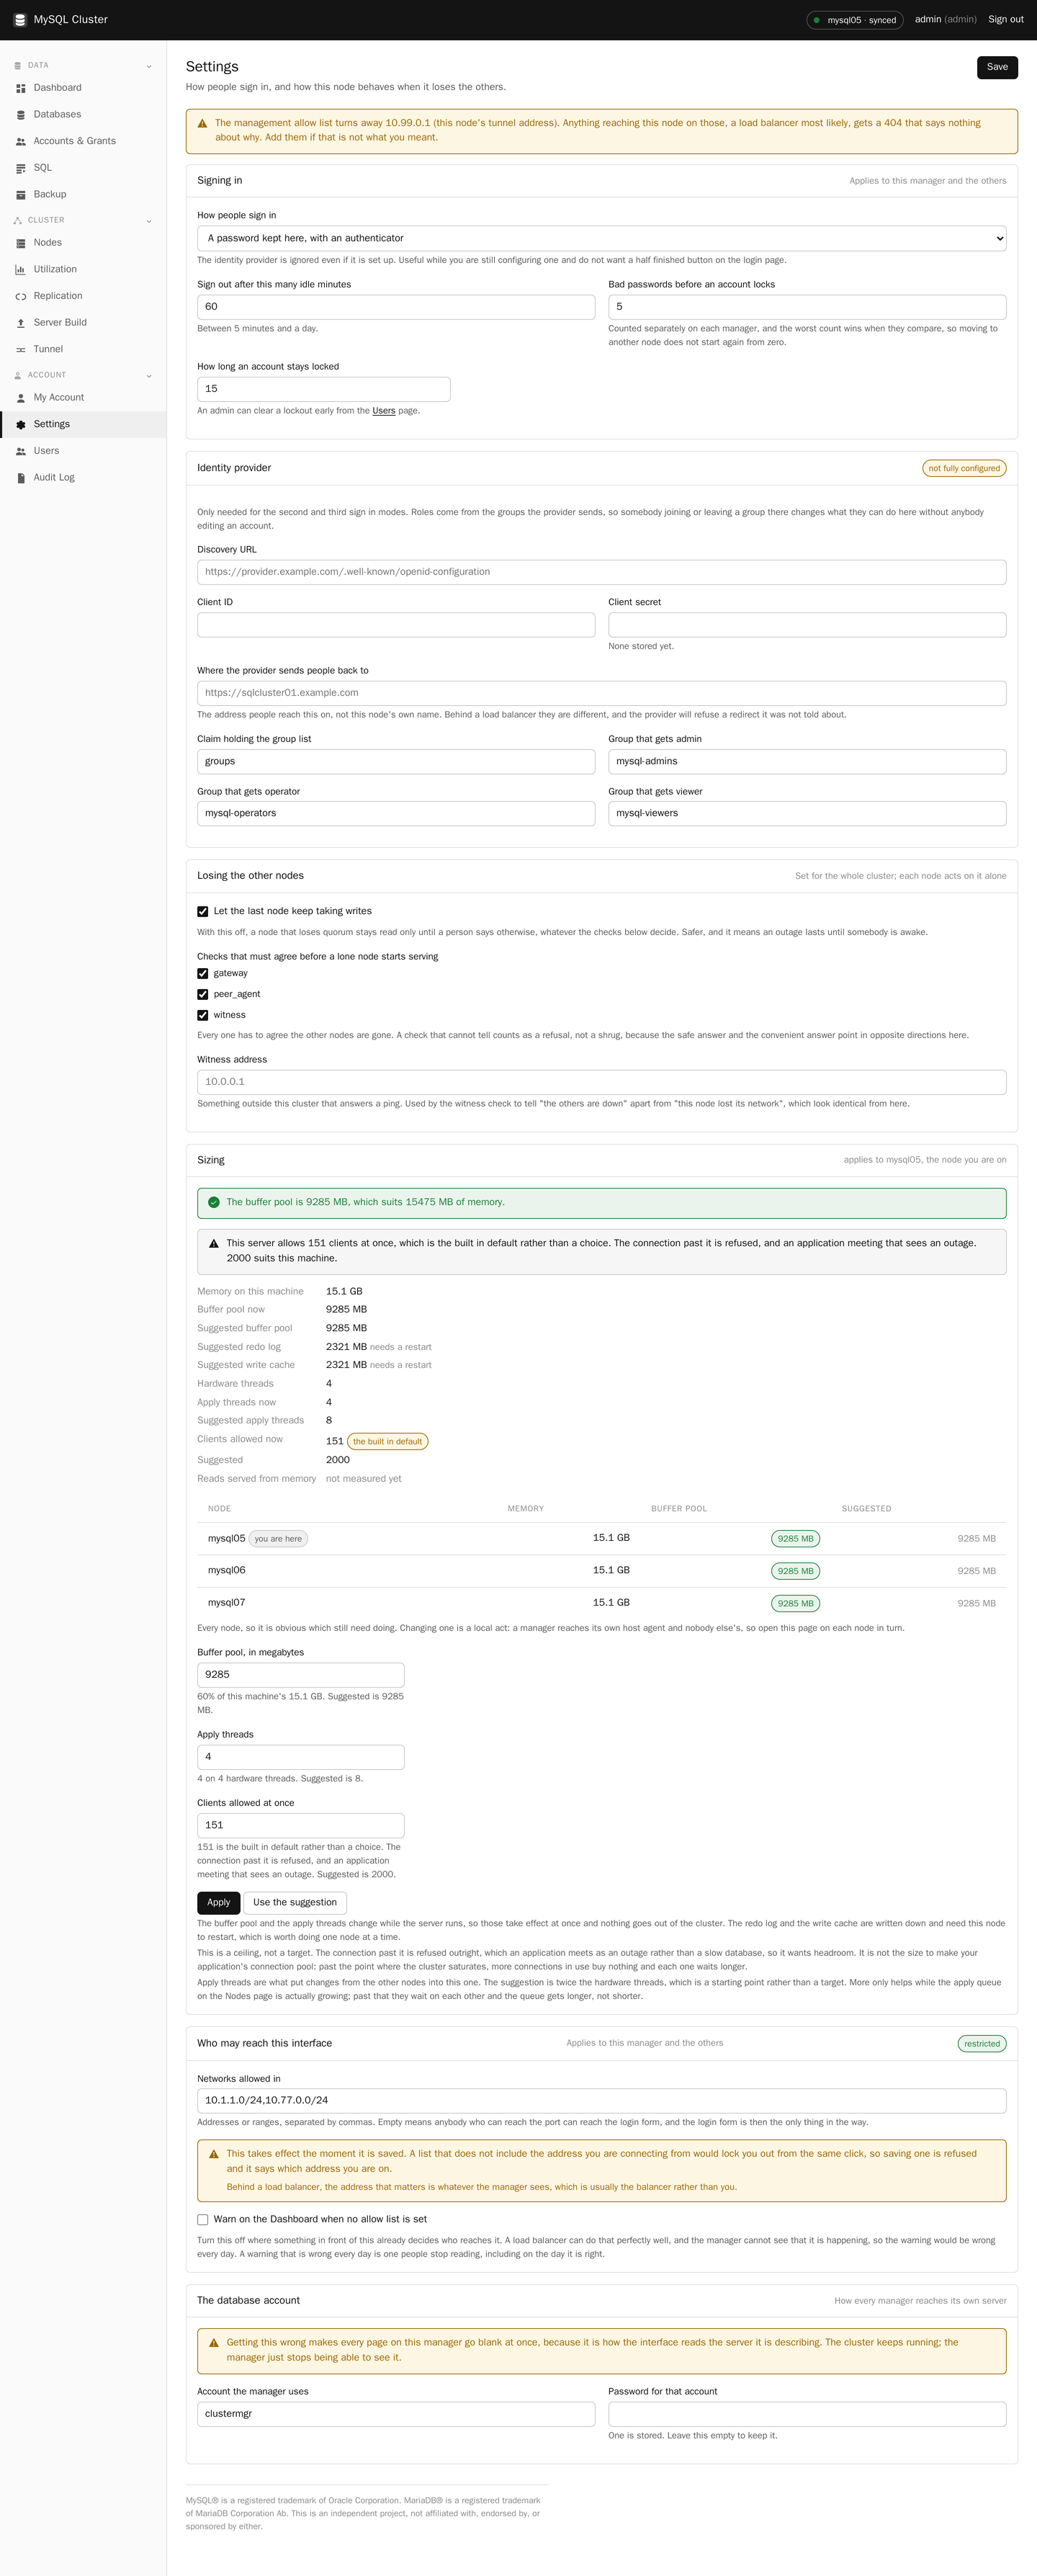
Sign in, what a node does when it loses the others, sizing, and who may reach the interface.
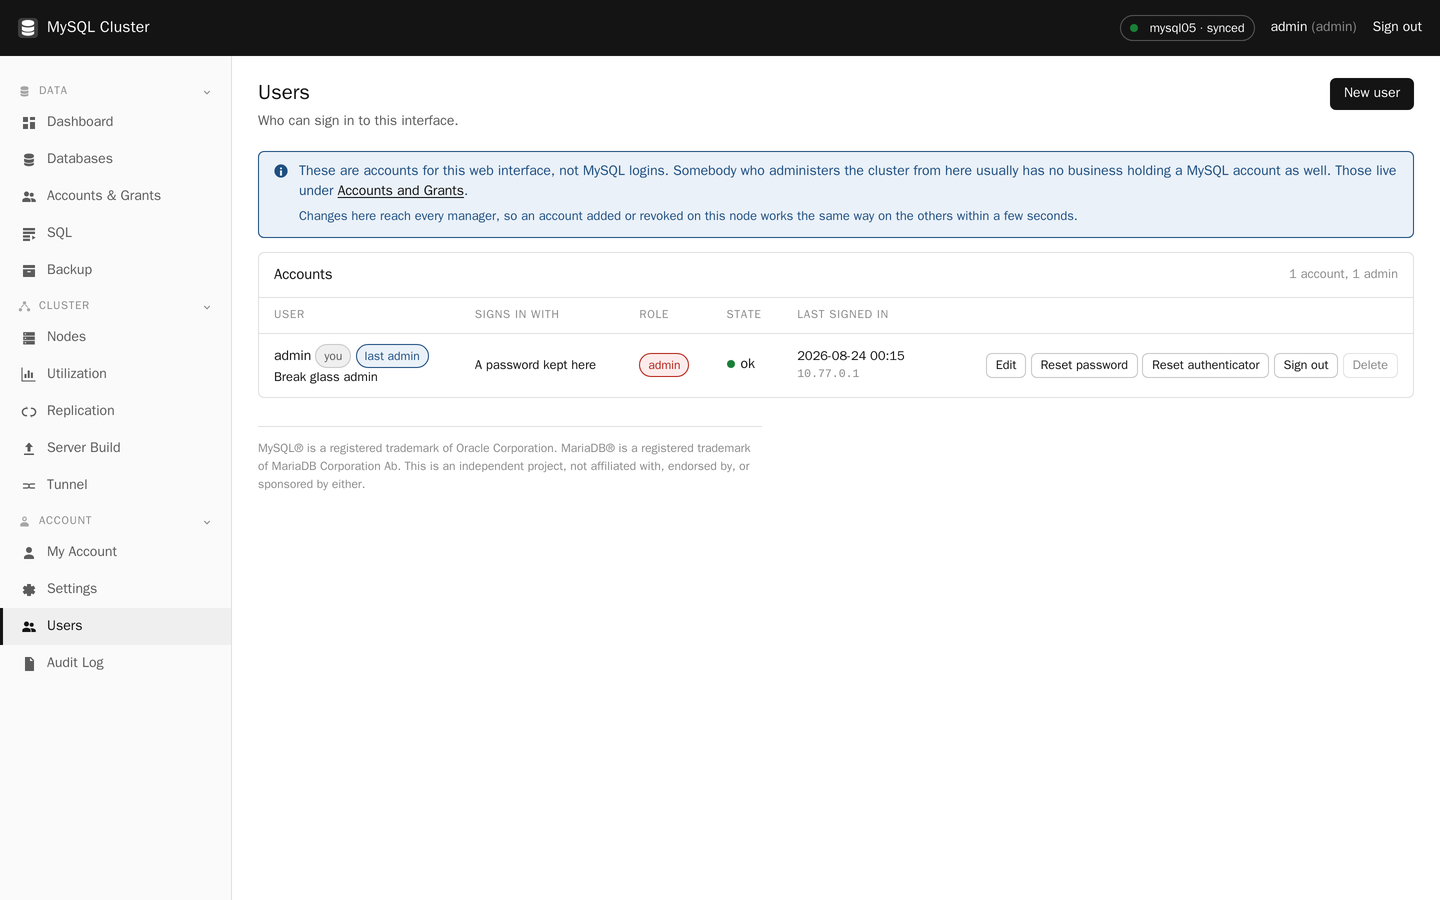
Who can sign in to the interface, with viewer, operator and admin roles.
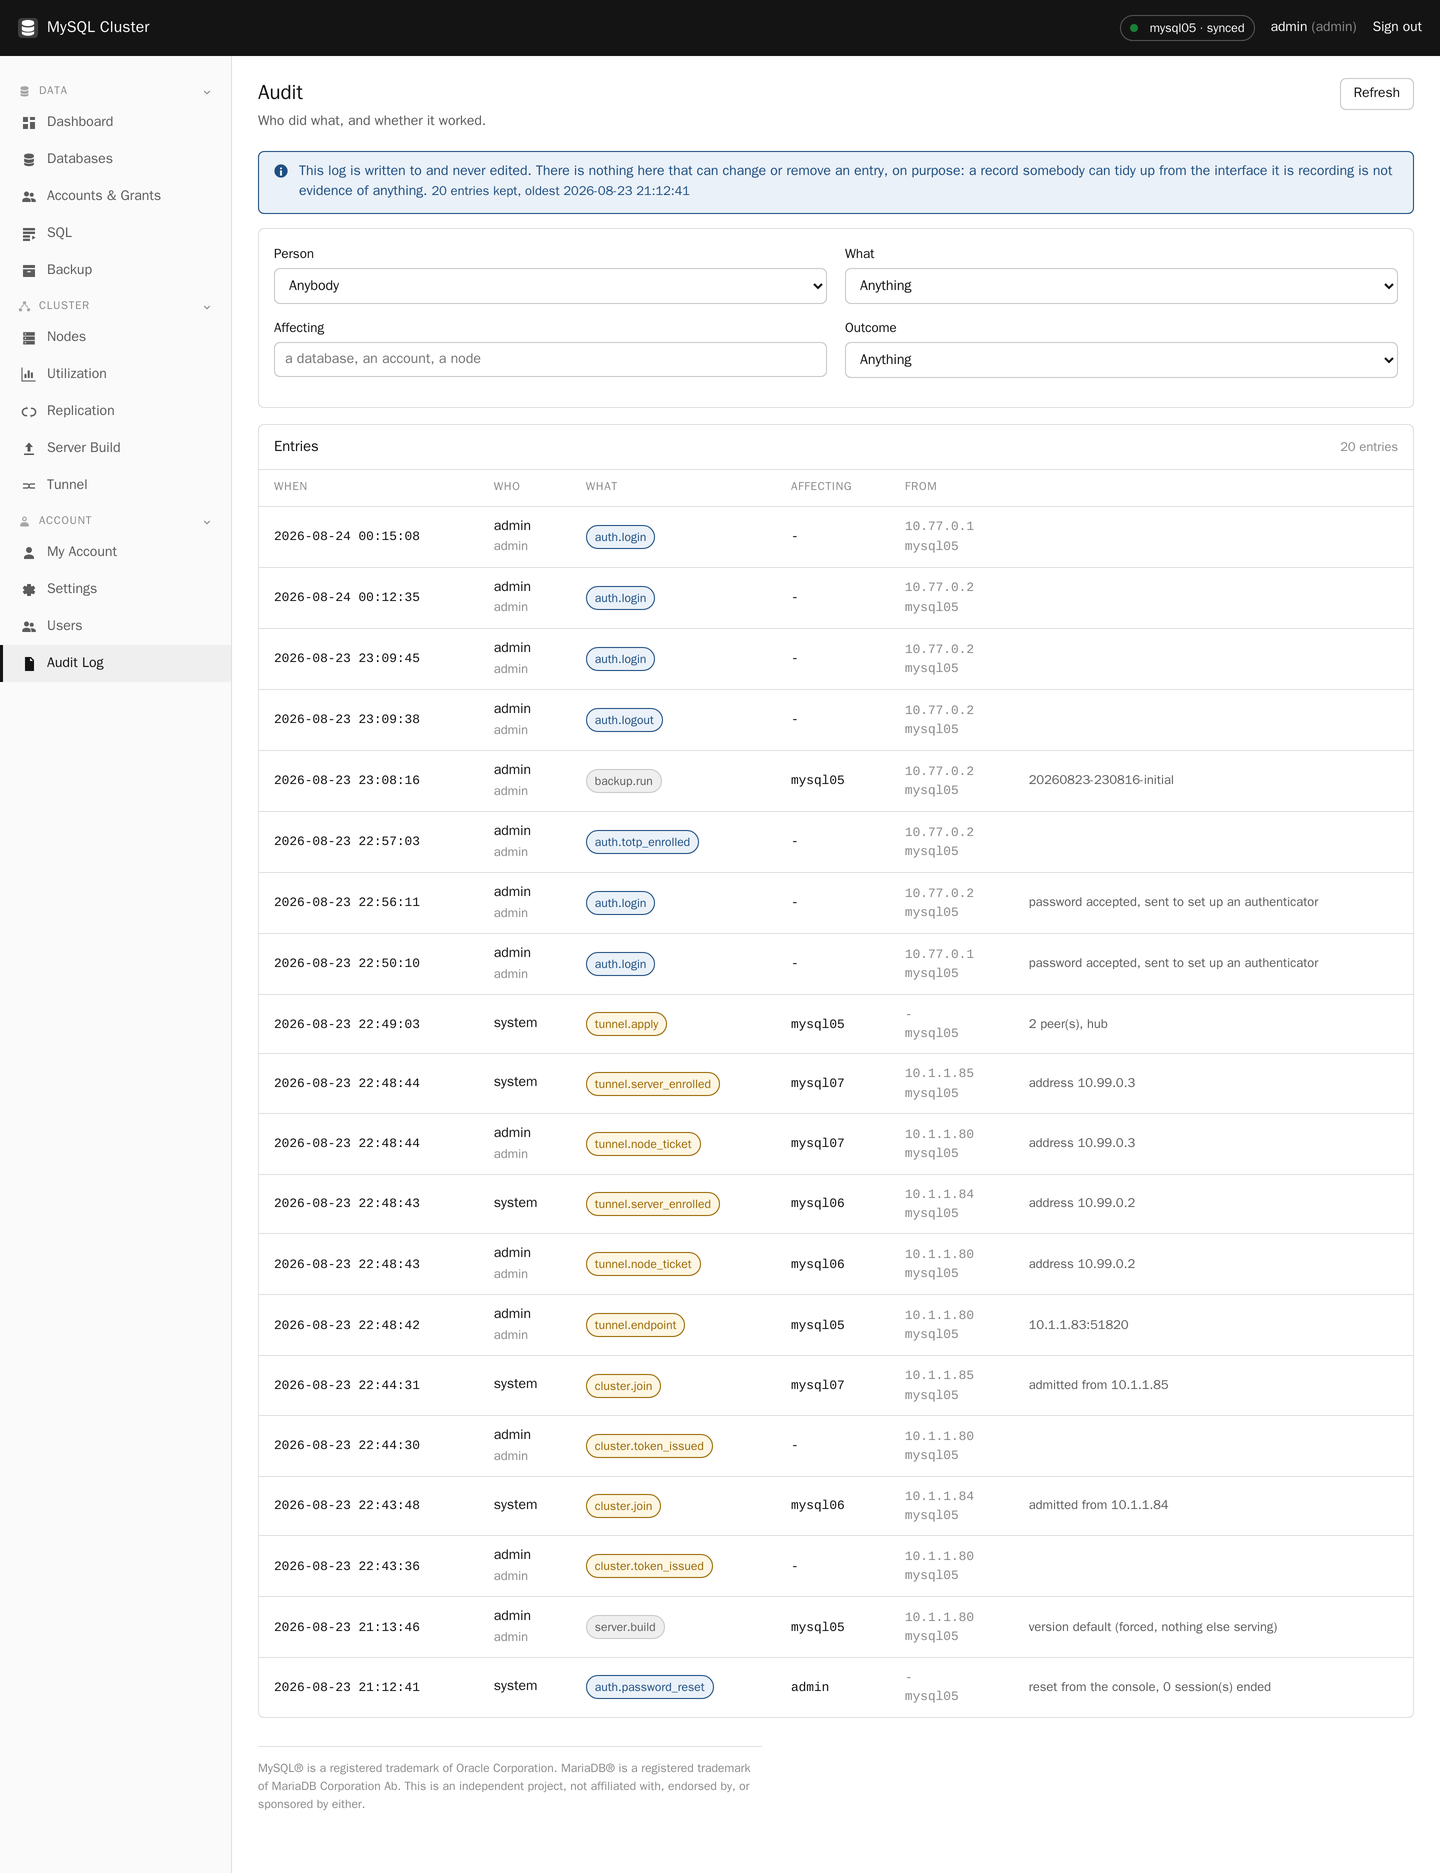
Who did what and whether it worked. Written to and never edited.
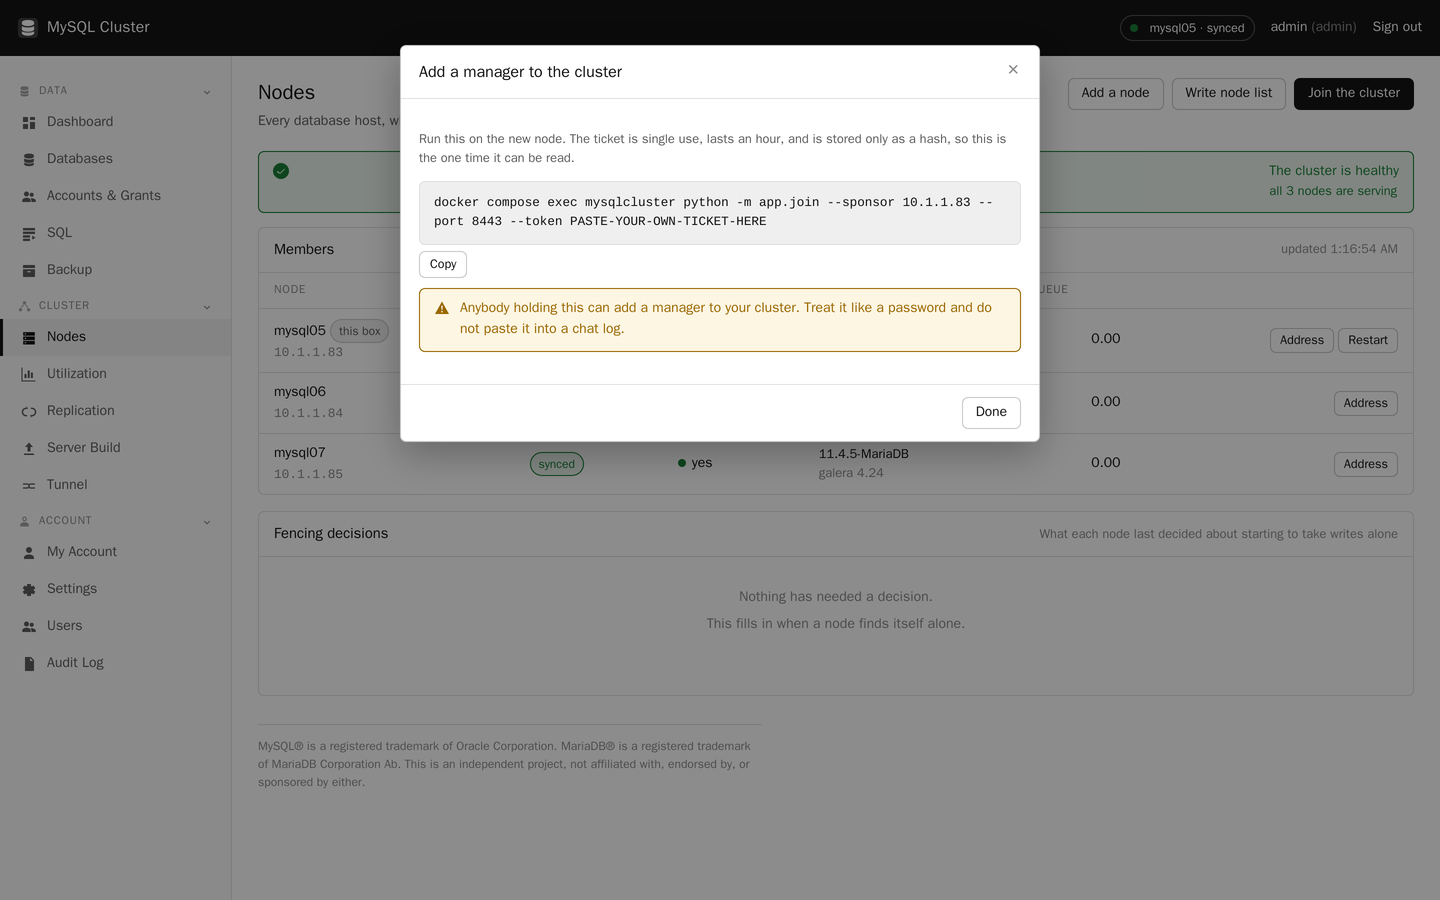
A single use ticket and the command to run with it.
A local account needs a password and an authenticator, because it is the way back in when everything else is broken.